Meet Pandas: Grouping and Boxplot
This post summarizes how to group data by some variable and draw boxplots on it using Pandas and Seaborn.
Table of contents
🐼Welcome to the “Meet Pandas” series (a.k.a. my memorandum of understanding Pandas)!🐼
Last time, I discussed differences between Pandas methods loc, iloc, at, and iat.
Today, I summarize how to group data by some variable and draw boxplots on it using Pandas and Seaborn. Let’s begin!
Load Example Data
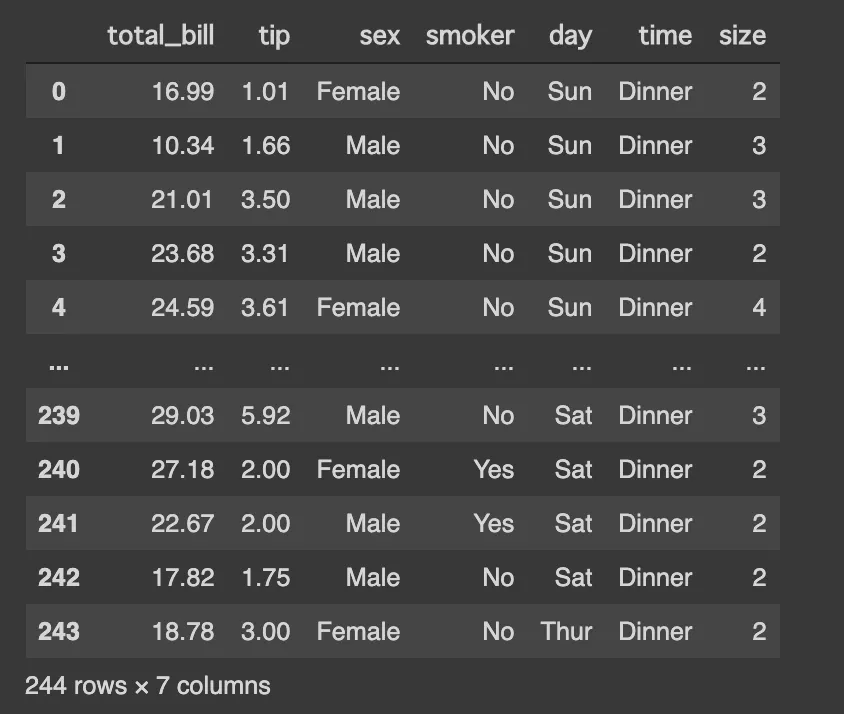
In this post, I use the “tips” dataset provided by seaborn. This is a data of food servers’ tips in restaurants with six factors that might influence tips.
The snippets in this post are supposed to be executed on Jupyter Notebook, Colaboratory, and stuff.
import pandas as pd
import seaborn as sns
sns.set()

df = sns.load_dataset('tips')
df
The dataframe should look something like this:
Group by Categorical or Discrete Variable
First, let’s group by the categorical variable time and create a boxplot for tip. This is done just by two pandas methods groupby and boxplot.
df.groupby("time").boxplot(column="tip");
* You can also group by discrete variables in the same way.
It’s not bad, but maybe too simple. If you want to make it prettier, use seaborn’s boxplot().
sns.boxplot(x="time", y="tip", data=df);
Or, catplot() should produce the same output.
sns.catplot(x="time", y="tip", kind="box", data=df);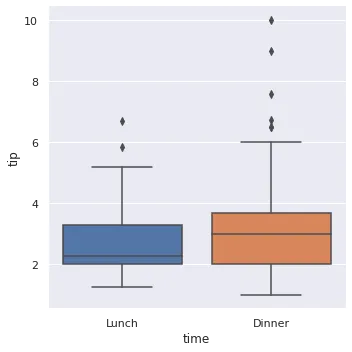
I’m not sure why it produced a figure of a little different size…
Other Distribution Plots
For larger datasets, boxenplot() gives more information about the shape of the distribution.
sns.boxenplot(x="time", y="tip", data=df);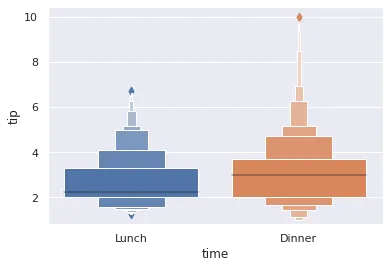
violinplot() combines a boxplot with the kernel density estimation.
sns.violinplot(x="time", y="tip", data=df);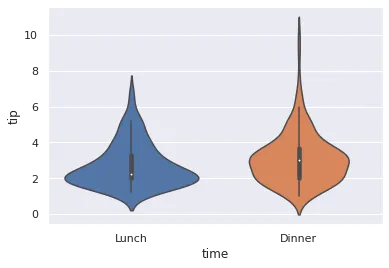
Group by Continuous Variable
Next, let’s group by the continuous numerical variable total_bill and create boxplot for tip. What happens if I use seaborn’s boxplot() function in the same way as above?
sns.boxplot(x="total_bill", y="tip", data=df);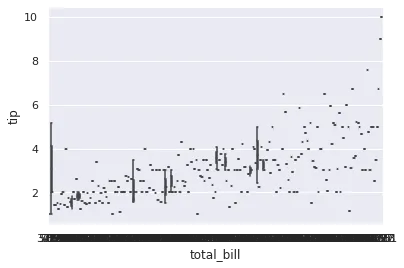
It divides the data into too many groups! This doesn’t really make sense. Well, I should have first bin the data by pandas cut() function.
df["bin"] = pd.cut(df["total_bill"], 3)
sns.boxplot(x="bin", y="tip", data=df);
Or, use qcut() (quantile-based cut) if you want equal-sized bins.
df["qbin"] = pd.qcut(df["total_bill"], 3)
sns.boxplot(x="qbin", y="tip", data=df);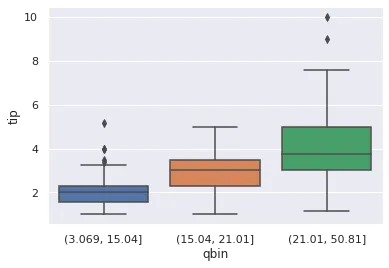
References
[1] pandas.core.groupby.DataFrameGroupBy.boxplot — pandas 1.0.4 documentation
[2] seaborn.boxplot — seaborn 0.10.1 documentation
[3] Plotting with categorical data — seaborn 0.10.1 documentation